Hot Times in the Old Town
Speaking of forest fires:

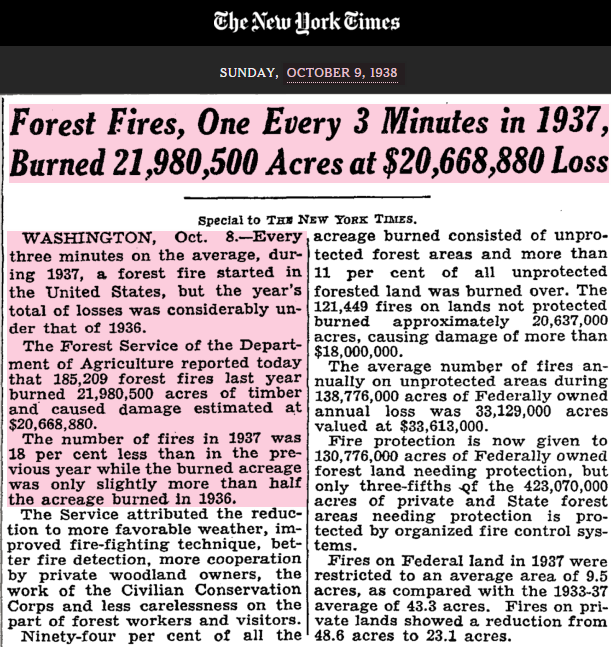
But in 1910, a few years after the Forest Service was formed and not on the above graph, "a devastating series of forest fires swept over Idaho, Montana, and Washington, culminating on August 20–21 in what is known as the "Big Blowup." Coming only five years after the U.S. Forest Service’s establishment, this seminal event made a deep and lasting impact on the agency. ... [T]he young agency was undermanned, underfunded, and underprepared for what was to come. ... On August 20 hurricane-force winds swept through the region and fanned embers and low flames back to life all across the Northern Rockies. There was no stopping or containing the fire; one could only hope to avoid it. Trains raced to evacuate towns just ahead of the flames."
Thus began the Forest Service's Smokey the Bear campaign to prevent forest fires. Unlike most federal programs, it seems to have been successful and involved among other things a program of "controlled burns" in Forest Service lands to clear out inflammable underbrush. About 30 years ago, TOF read an article about the end of the controlled burn program because it was non-environmental: Nature should be allowed to take its course, even if that meant occasional wildfires. Hey, it's Nature!
Lo and Behold! As the underbrush and deadwood once more accumulated, the number of burned acres began to increase slightly, starting roughly ten years ago.
Flood and Mud
Fires were not the only thing going on.
ALL EASTERN AMERICA UNDER FLOOD WATERS
Terrible Duststorm Rages In West
PRESIDENT SIGNS
APPEAL AS
CAPITOL FLOODED.
100 CITIES AND 14 STATES AFFECTED.
NEW YORK. Thursday.
A quarter of the area of the United States wasunder flood waters today. It is a disaster rankingwith the worst calamities from natural causes thathave occurred in the history of the nation. Propertydamage is so great that it is almost incalculable. Lossof life may exceed 1000 for already 160 fatalities areknown and 40 people are missing.As Eastern American States became almostcovered with water, terrible dust-storms raged acrossthe central and western States, tearing the crops outby the roots and laying waste thousands of squarestorms, it rained mud.miles of country. Where the dust struck snow
Just in case you've been getting a-skeered by weather coverage lately.An extraordinarily dramatictouch was given to the Presi-dent's appeal to the nation forRed Cross fund for, even as hesigned the proclamation, thous-ands of Works Progress Admin-istration workers were strug-gling desperately to erect bul-warks against the waters of thePotomac River which rapidlyare approaching within a fewsquares of White House itself.
Hurricane Season Off to a Whimper
Fascinatingly, the weatherfolk watching the tropical Atlantic have been reduced to reporting on a "scary," nameless "disturbance" (Invest 99-L) that might grow up to be a tropical depression that could deepen into a tropical storm that might be intensify into a hurricane that could reach Cat. One. This is because there has been, contrary to theory, a decided dearth of actual hurricanes to speak of for the past 11 years; although since we started naming tropical storms it does not actually seem so when one reviews the named storms. There is now a move to name tropical depressions in order to keep the count up. For now, the headlines will have to read:
An amazing stretch of almost 11 years without a major hurricane
may or may not be coming to an end.
may or may not be coming to an end.
Hot Enough Yet?
Speaking of heat waves, in 1936 a heat wave caused 12,183 deaths in the US, the NY Times reported (July 7, 1936)The Chicago Tribune reported a week later (July 14, 1936) that hundreds had died in Detroit from the heat wave and that Chicago itself was also baking.Meanwhile, over in Ohio, the Chillicothe Constitution-Tribune in Ohio (July 25, 1936) tells us:
CROP CRISIS WORSE,with a sub-head that
HEAT RISING TO 119°
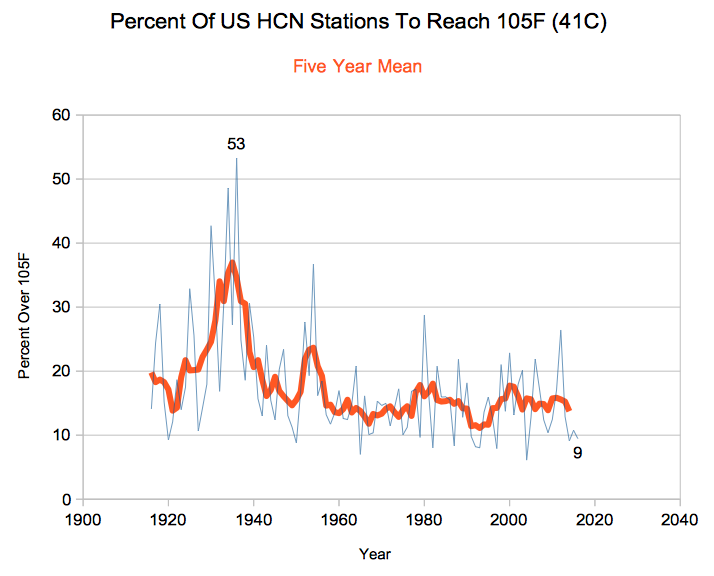
31 CITIES ARE OVER 100°Ach, du Lieber! TOF hears you ask, How many days went over 105°F?
Hard to say, but here is the graph of the percentage of US HCN temperature stations that hit that level sometime during the year:
The 1930s also featured worries about global warming
Warming Arctic Climate Melting Glaciers Faster, Raising Ocean Level, Scientist Says
“A mysterious warming of the climate is slowly manifesting itself in the Arctic, engendering a "serious international problem," Dr. Hans Ahlmann, noted Swedish geophysicist, said today.
– New York Times, May 30, 1937
A ship was reported to have made the Northwest Passage across open waters, but TOF has not located the report.
So, the world rallied and did nothing and before you could say Jack Robinson, the Times was reporting:
“After a week of discussions on the causes of climate change, an assembly of specialists from several continents seems to have reached unanimous agreement on only one point: it is getting colder.”
– New York Times, Jan. 30, 1961
And just to emphasize the everything old is new again theme, 1938 was also the year Hilaire Belloc wrote his warming that Islam, though then quiescent could easily revive and threaten once more the cities of the West.
The common root to all this is short term memory.
"[M]en are always powerfully affected by the immediate past:
one might say that they are blinded by it." -- Hilaire Belloc


I favor "the Kachinas are angry". It's a lot more rational than most AGW alarmism.
ReplyDeleteYour percentage of US HCN temperature stations graph is inconclusive for proving that recent heat waves aren't worse. For one, the percentage is not giving you how many temperature stations there were from each year, nor where they are. It's also not giving you the global average temperature, which is what the climate question is all about.
ReplyDeleteThat hurricane stat is also misleading. It doesn't count Sandy which was one of the costliest disasters in American history. It's also a limited sample size because the US coast is only a small portion of the world's oceans.
I am sorry, O Nameless One, but percentage is percentage. NOAA's HCN (Historical Climatology Network) is a set of 1221 stations (previously 1219) chosen so as to be uninfluenced by heat island effects and other such pilpul. A list and history can be found here:
Deletehttp://www.srh.noaa.gov/srh/dad/cli/HCN-Stns_CR.pdf
Our human penchant for being overly influenced by recent impressions is likely due to the fact that most of those being impressed weren't around in the 1930s. My own father, now in his 90s was then a toddler and not keeping a weather eye out.
The stations have all been in continuous operation since 1900 and there has been no substantive change in the denominator across the duration of the graph.
This is not about the "climate question" but about "weather."
Disasters of the same magnitude are more costly today because the dollar has dropped in value and more property has been developed on flood plains and coastlines than was previously the case. Sandy was more destructive than the almost identical "Long Island Express" unnamed hurricane of 1938 largely because there are a) more people and houses in the way and b) prices are way inflated over 1938: $100 in 1938 is $1706 in 2016 from inflation alone, without taking account of things like features in housing, cars, etc. that were no possible or available in 1938. (http://www.weather.gov/okx/1938HurricaneHome)
For the terrible Mississippi River floods of 1927 that gave us the TVA: http://tofspot.blogspot.com/2016/03/ive-never-seen-it-this-bad.html
Agreed: people think the hurricane count is up because we're comparing apples (satellite detection) to oranges (ship reports and landfalls). But the current dearth of hurricanes is by dint of weather satellites.
No it is the climate question, because you are making claims that recent weather is not any different from the past.
ReplyDeleteYour temperature graph is also not dealing with averages. The way you tell temperatures are going up or not is to check how many stations are showing departure from average temperature for time of year, not how many stations hit X temp.
Also, there isn't a dearth or hurricanes, it just so happens the US hasn't been hit luckily. But the rest of the oceans have been quite active.
Your temperature graph is also not dealing with averages
DeleteTechnically, neither is anyone else. They are dealing with the outputs of models, not actual averages of measurements. This is due to the homogenizing of data to identify anomalous stations, such as a new instrument or an uncalibrated instrument. Unfortunately, such adjustments in the face of serially correlated data will often pick up anomalies even when they are not there, and if the statistical adjustments of the data are automated (as they are in this instance) the measurements will be tweaked even when there is no reason to tweak them. See also:
http://tofspot.blogspot.com/2014/04/americas-next-top-model-part-iv.html
Raw temperatures were higher in the 30s. The adjusted data shows the 90s as being higher. Curiously, the adjustments also have been lowering the 40s, and you'd think it would be unlikely to experience a cooling of the past over time.
The way you tell temperatures are going up or not is to check how many stations are showing departure from average temperature for time of year, not how many stations hit X temp.
Oh dear, then the media needs to be told, lest they hype every heat wave as if it were unprecedented. In this latest run, however, I did not see any newsreader ascribe the heat wave to global warming, unlike previous instances.
The same goes for hundred-year floods and the like. These are all examples of what are called extreme value events and and they follow an extreme value distribution, beloved by reliability engineers. The amusing thing is that if you take a distribution of a measured property and estimate the percentage beyond a particular cut-off, like an upper specification limit in industry, then if you shift the mean value of the distribution upwards even slightly, the percentage of measurements falling outside the spec limit will increase dramatically. A simple example is the normal distribution. Consult the normal tables for Z=(USL-mu)/sigma to get the estimated percentage from the model that falls above the Upper Spec Limit. Now make mu higher and rerun the calculalation. You will typically find a big jump in the % out of spec for even a modest increase in mu.
Also, there isn't a dearth or hurricanes, it just so happens the US hasn't been hit luckily. But the rest of the oceans have been quite active.
Good for them. We better tell the weather service.
Also, there isn't a dearth or hurricanes, it just so happens the US hasn't been hit luckily. But the rest of the oceans have been quite active.
Delete...
That's EXACTLY what TOF said! Can you read??
Logging was also stopped in a large number of places during the 90s, so there isn't the thinning (especially of dead wood and young, tightly packed trees where all the lower branches die) and they aren't upkeeping the logging roads. About 98 or so, at least in our area, the Forest service started randomly destroying the old logging roads-- we're talking 20 foot trenches in multiple places to make sure you can't get up them. They weren't always careful to make sure that they were legally allowed to do it-- my family manages some cattle on grazing permits, and there were some ugly situations when state roads got removed.
ReplyDeleteThis makes it really hard to use them to fight fires.
They've also put in policies, at least in Washington, to not stop "natural" fires.
That's how Washington got record-setting fires just recently.
Testing.... (Sorry, it put a funky email in for the last one, even though I typed my wordpress in; I think my cousin checked her email on my machine and didn't practice good security. Or blogger's being funky.)
ReplyDeleteYep, bloggers being funny.
ReplyDeleteLast attempt and then I'll stop spamming you. :/ My apologies.