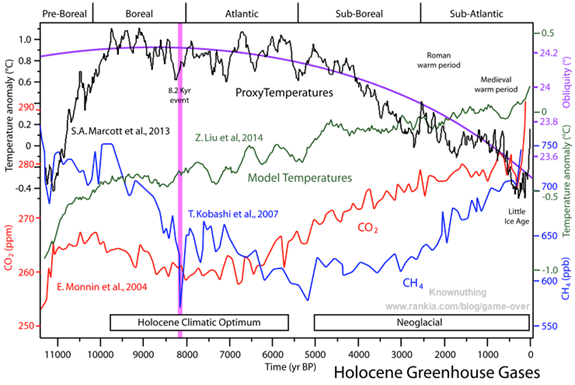
Unless I should say the "Whole Scene." Reconstructed "proxy" temperatures shown in black and model output temperatures in green are compared to atmospheric CO2 in red and methane in blue during the recent interglacial phase. When CO2 began increasing some 7000 years ago, global temperatures did not actually change and when they did, about 2000 years later, the world grew cooler, not warmer. The model outputs grew warmer, however. Notice that in the Modern Warm period, temperatures did increase when a special magical kind of CO2 took over. Either that, or a random fluctuation. In any case, a 5000-year long slide back into an ice age seems to have been temporarily stayed and temperatures have returned to medieval levels, and perhaps almost to Roman levels, although not nearly to normal levels for the interglacial, which were closer to +0.9°C
Data sources noted for each series on chart.


So the steep CO2 increase on the far-right side of the red line, which looks like nothing that has happened in the past 11,000 years, has nothing to do with fossil fuels? And so too for the proxy temperatures? Just a global conspiracy of alarmism, or whatever?
ReplyDeleteNo, it's obviously special magic CO2, like I said.
DeleteLook at the year BP it ends at 1950.A common ploy for deniers. From 1950 to 2017 the CO2 has risen most rapidly. Not only is the above graph misleading by avoidance of 1950 - 2017 data it does nothing to elucidate anyone to the FACT that the carbon in volcanic CO2 emissions has a different fingerprint to the carbon from dirty energy which is being released yearly at 40 billion tonnes.. identifiable by its carbon fingerprint.
DeleteYes, special magic CO2, as I suggested.
DeleteAh, another religious apologetic blog that desperately tries to convince people that Christianity is compatible with science...and then proceeds to reject climate change.
ReplyDeleteSo in other words you have absolutely no ability to address the scientific argument, but are sure it's false, because of your faith in the members of a clerical class whose status is marked by long white garments.
DeleteThose of us who have the arch refer to that as "irony".
Ah, another commentator hiding behind anonymity blithely mischaracterizing the blog and then proceeding to deny the scientific data that was presented without comment.
DeleteNo one glancing at the history of the Holocene as shown can deny that climate changes.
Hey, TOF, I wonder if someone linked to your journal from an atheist blog or something, given the sudden influx of people who have obviously never seen your blog before, given that this isn't your first time addressing such topics.
ReplyDeleteI'm not sure what interest atheist bloggers might have in the paleohistory of the Holocene.
DeleteHey Anonymous Commenters: any digs at religion should be preceded by a good explanation of the supposed infallibility of science. For proofs, I would accept a scientific explanation of "time" or a scientific accounting of the mass of the universe (as in, why can't science account for more than 4.9% of the mass-energy of the universe. "Dark matter" is the current equivalent of "here be dragons".)
ReplyDeleteChristianity is perfectly compatible with reason and logic; much of what goes by the name "science" today is not.
"Some part of this system does not work like the rest of it" is perfectly rational. Real scientists don't pretend to have any certainty about dark matter.
DeleteAnd the scientific explanation of time is basically the same as the one used by theologians back at least to Augustine; about the only thing we've truly added to our understanding of it since Aristotle, is relativity's insight that it's a function of the geometric properties of a given region of the universe (it sounds weird until you understand the math involved—"that sounds outlandish" is not an argument, though). That aspect of relativity's been borne out by experiments, by the bye.
Don't commit the same fallacy as the people whose fallacies you're pointing out.
However, the moment religious believers admit that they don’t have complete certainty about God, the so-called Brights take this as positive proof that God does not exist, that there is no evidence for his existence, and that religion is completely irrational. Zach is right: Let them make the same demands for apodictic certainty about the things they believe, and we can take seriously their demands for such certainty about the things they don’t believe.
DeleteRichard Dawkins doesn't even know gamma rays from cosmic rays; asking him to explain something as funky as dark matter is like mocking the proverbial 98-pound weakling that he can't win a heavyweight fight. He can't even win a bantamweight fight.
DeleteThat is an very interesting chart, but I think you are reading too much into the small changes in CO2 shown there.
ReplyDeleteThe Monnin et al (2004) data is here here.
The latest CO2 value is for 173 years before 1950, which is 1777 roughly the start of the Industrial Revolution. In other words, your CO2 only runs until soon after the end of the Little Ice Age, and that explains why temperatures rose then, not the increase in CO2 which is not shown by Monnin et al who have CO2 at around 280 ppm from about 1066.
Since then it has risen to over 400 ppm, and that is what is causing the recent warming, despite that obliquity, the main driver of interglacial temperature, has continued to decrease.
CO2 is not the only driver of global temperature, and that explains why the models, which over emphasise the effects of CO2, are wrong. However, the sharp rise in CO2 of 2.5% 11,000 years ago seems to have triggered the abrupt rise in temperature that lasted until 10,000.
What is going to be the effect of the sharp rise in CO2 of nearly 50%, up to 400 ppm (well off the chart), that has happened over the last 200 years?
You're right. The magic CO2 released in recent years must have had the effect that all the previous years have not. The glacial age was in fact when the there was too little CO2 in the atmosphere: about 180 ppm, compared to today’s 400 ppm.
DeleteCO2 starvation—killed most of the plants on earth. Only a few trees survived, in the mildest climates. Much of the planet’s grass turned to tundra. Humans had to turn to wandering hunters roaming the treeless savanna to catch enough herbivores to survive. Some accounts say that there were as few as 10,000 humans left alive.
Our crop plants evolved about 400 million years ago, when CO2 was about 5000 ppm. Evergreen trees and shrubs evolved about 360 million years ago, with CO2 at 4000 ppm. Deciduous trees evolved about 160 million years ago, with C02 levels around 2200 ppm. We are perilously close to the lower limit when plant life may shut down.
Since the Arhennius effect is logarithmic, successive doublings of CO2 produce successively smaller increases in temperatures. So the models assume that the warmth generated by CO2 results in the atmosphere retaining more water vapor -- and H2O is the 900-pound gorilla of greenhouse gasses! The problem is that there has been no increase detected in atmospheric water vapor, which is why the models run hot compared to the real world. In fact, you more often hear about drought and dry, tinder-like conditions supposedly associated with global warming than you do about severe rain storms and the like. Depending on what the current weather is like, one model or another can be trotted out.
Paleotemperatures tend to run ahead of the CO2. This makes sense if ocean temperatures are involved, since the warmer the water, the less CO2 it can hold in solution. Hence, a spike in temperatures can easily lead to a spike in CO2, as the oceans release the gas.
You are correct too. The average CO2 during glacial periods is 180 pppm, but during interglacials it is 280 ppm, not 400 ppm. It has not been that high for about two million years. That is why the scientists are worried.
ReplyDeleteI am curious to know where you got your chart from. Did you produce it yourself, or can you give me a URL of where I can find the original?
I second this question. I *want* the chart to be accurate, but alas, I see no sources cited.
Delete11 000 BP = 9000 BC, right?
ReplyDeleteSo, this is from Göbekli Tepe to now ... I have identified GT with the (city of the) Tower of Babel (with no tower visible, and no ruins of a tower needed either).
I am also into calculating what such ages correspond to (here obviously using identification to do correspondence). Here is a table using the chronology of Syncellus, which I will later redo for chronology of St Jerome, quoting relevant part:
XIII 2865 BC
33.994 pmc 11 785 BC
Shem + 2858 BC
Peleg * 2829 BC
XIV 2824 BC
44.057 pmc 9600 BC
Arphaxad + 2791 BC
XV 2780 BC
49.459 pmc 8600 BC
Cainan + 2763 BC
XVI 2739 BC
51.476 pmc 8229 BC
Obviously, having had less than 50 pmc = percent modern carbon, the organic material from GT has a bit more than 5730 extra years in carbon dating. Here is the full table.