Faithful Reader may recollect from an Earlier Post how TOF mused upon the collective result of a cycle riding on the back of a trend.
TOF first encountered this notion in a 1947 book (Cycles, by Dewey and Dakin) regarding economic cycles, and noted it himself when he plotted annual US birth rates, in which the cycle rode aback a declining trend.
 The cycle depends upon annual figures, which began only in the 20th century, but the trend can be traced in decennial census records back to 1820. How the birthrates declined without Pres. Monroe instituting a 2-Child Policy and Government-Funded Birth Control is a Great Mystery to those Late Moderns who believe in the puissance of the Daddy State.
 That cycle-atop-trend might apply to "global temperature" was first adumbrated to TOF also around 1990 in a chart of Danish data that overlaid temperature and the solar cycle length (inverse scale). (Solar period averages 11 years, but as they say, "on the average, we're all dead." The cycle actually runs faster and slower.) Remember this was at the tail end of the Global Cooling rage and before Global Warming had become the established religion.

The notion as TOF understands it was that as the sun "beat" faster, it hit solar max more often in a given time span and so the earth would get warmer. As it slowed down, the sun would hit max less often and the earth would cool. At the time, Global Cooling had been all the rage, so TOF was startled to see this beautiful science bludgeoned to death by some ugly facts. Global Cooling was actually that downward "trend" from about 1940 to about 1970. Based on this, TOF prophesied at the time that the new upward trend would run from 1970-2000 and starting about AD 2000, temperatures would once again top off as they had in the 1940s. IOW, TOF predicted the current "pause." Yay! And also the cooling that is about to overtake us (2000-2030), now that the sun has gone out. Boo!
Notice how in the following graph, global warming (longer term) has coincided with a solar Grand Max as reconstructed from Be-10 proxies. From ca. 1900 to 1950, solar activity shifted from normal to high gear, turning up the burner, as it were.

The recent drop in solar activity, starting 2003-2005, is the largest drop since the Napoleonic era, in which it ushered in the Dalton Minimum, the Retreat from Moscow, and all those picturesque Currier and Ives engravings with huge snow mounds and horse-drawn sleighs. It is the second biggest since the Maunder Minimum of the late 1600s, which ushered in the Little Ice Age.
- a linear trend consisting of the rebound from the Little Ice Age, which likely is the same thing as the sun moving into his Grand Max.
- a 50/60 year cycle corresponding to the Atlantic and Pacific oscillations.

But this is:
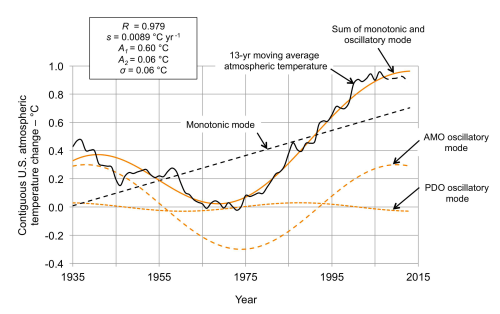
The Effect of Natural Multidecadal Ocean Temperature Oscillations on Contiguous U.S. Regional TemperaturesA chart omitted from the final draft, but provided by Dr. Curry on her blog shows in the actual data what the previous chart hinted at in principle.
Bruce Kurtz
Abstract. Atmospheric temperature time series for the nine climate regions of the contiguous U.S. are accurately reproduced by the superposition of oscillatory modes, representing the Atlantic multidecadal oscillation (AMO) and the Pacific decadal oscillation (PDO), on a monotonic mode representing, at least in part, the effect of radiant forcing due to increasing atmospheric CO2 . ... Temperature vs. time curves calculated by combining the separate monotonic and oscillatory modes agree well with the measured temperature time series, indicating that the 1938-1974 small decrease in contiguous U.S. temperature was caused by the superposition of the downward-trending oscillatory mode on the upward-trending monotonic mode while the 1980-2000 large increase in temperature was caused by the superposition of the upward-trending oscillatory mode on the upward-trending monotonic mode. The oscillatory mode, mostly representing the AMO, was responsible for about 72% of the entire contiguous U.S. temperature increase over that time span with the contribution varying from 86 to 42% for individual climate regions.
Someday, when TOF learns why the printerscanner has vanished from the ken of his computer, he will scan some of those charts and show them.


Sincerely curious, wouldn't you say that methane and CO2 cause the earth to get warmer? And isn't it also true that we've released billions of tons of these gases in the last few decades? I hope that you're right but I wonder ...
ReplyDeleteOf course, they do. But how much? The relationship is logarithmic. That is, successive doublings of CO2 produce progressively smaller increases in temperature. Billions of tons always sounds worse than fractions of a percent. In order to make the CO2 effect apocalyptic enough to motive wealth transfer, we must posit a host of "feedback" effects that are not so well-established. It's early days yet and we're still in the "phlogiston and caloric" phase.
DeleteThe Martian atmosphere is 95% CO2, so there must be something else involved, else Mars would be sweltering hot.
Interesting, I see ... why do you think that so many climate scientists (97% or so) hold the catastrophic view?
Delete(I know that you mentioned trends / careers, etc., but is that the only reason?)
DeleteBut the Martian atmosphere is also a lot thinner, right? That would be the "something else" involved which helps explain why the greenhouse effect on Mars is so weak, right? In any case, I like your comment that we're still in the "phlogiston and caloric" phase of all this.
DeleteI'm not so sure that 97% do. We should not cite the 97% agree on X until we're quite sure what X was defined to be. In fact:
DeleteThe point of contention is a peer-reviewed study published last year [by John Cook and coauthors] . The scientists examined 4,014 abstracts on climate change and found 97.2 percent of the papers assumed humans play a role in global warming.
"Play a role" is not the same as "catastrophic." Most of the skeptics believe humans "play a role." That's how you get a 97%. The question is how much of a role (and how bad the effects)?
http://judithcurry.com/2014/07/27/the-97-feud/
“I’m a hopeless romantic for the Enlightenment: I’d rather convince people with arguments than with an appeal to authority or consensus,” Tol said via email.
same source
Nuccitelli’s survey results are either the result of a comprehensive failure to understand the climate debate, or an attempt to divide it in such a way as to frame the result for political ends.
http://judithcurry.com/2013/07/26/the-97-consensus/
http://judithcurry.com/2012/10/28/climate-change-no-consensus-on-consensus/
There are also articles like this:
Deletehttp://wattsupwiththat.com/2014/12/19/97-articles-refuting-the-97-consensus-on-global-warming/
collecting refutations of the various possible 97% stories.
There are also interviews with authors of some of those articles that were claimed to support man-made global warming, including the guy who was pointing out that global warming matched up with sun spots. No mention of man's influence.
Re: Martian atmosphere. Right, and also total solar irradiance -- Mars is farther from the campfire.
ReplyDeleteInterestingly, Venus, Earth, and Mars all had 95% CO2 atmospheres to start with, but on earth, life began and ate up a lot of the CO2, exhaling O2 and making the whole shebang possible.
"Venus, Earth, and Mars all had 95% CO2 atmospheres to start with"
ReplyDeleteHow many scientists were around taking measures of it back then?
On a more general note, one of the early studies and one which has been very often cited for "global warming" was a study by Ichtiaque Rasool.
ReplyDeleteAND he admitted fairly and squarely at least, that what could be told of the carbon cycle was too tentative. Si vous lisez le français ... clicquez le lien vers ma revue de ceci.
Willis Eschenbach at WUWT has put in a lot of effort in looking for the solar signal in a variety of climate data (direct temperature and proxies). He has yet to find one. Leif Svalgaard is of the same opinion. This should be taken into account in the above.
ReplyDeleteAnd yet there it is. With seven factors you can always fit a model as long as you can adjust the coefficients. Since these "seven" factors "explain" all the variation, any attempt to find an eighth factor is frustrated. The R^2 will barely budge. Besides, the solar influence may already be there, buried inside some other factor. (E.g., the MDO may be due to solar influence; likewise cloud cover due to cosmic rays due to solar magnetic field.) Difficult to find because the principle components used in the models are not generally the measured variables one started with.
DeleteAny solar influence to be taken seriously must show an eleven year effect on temperature. Your Danish graph (source?) of the effect of the period of the sunspot cycle is a second order effect and thus if it is there the roughly eleven year cycle must be stronger. The solar insolation is easily measured. In this regard see:
Deletehttp://wattsupwiththat.com/2014/04/10/solar-periodicity/
http://wattsupwiththat.com/2014/06/23/maunder-and-dalton-sunspot-minima/
Seven factors, seriously?
If it were the only factor, you would expect to see a marked cycle; but who says it's the only factor? Systems have viscosity, and if this runs longer than the 11-year average, then it's the frequency of the max and not the amplitude that matters. And who says that the direct irradiance is the operative variable? Two things may correlate without any direct causal connection between them. Both X and Y may correlate because each is the consequence of a lurking variable Z.
DeleteThere must be a reason why the earth has been growing steadily cooler during the 3000 years since the Minoan Warm Period. The Holocene average looks to be about 4.5°C until about 1000 BC and has dropped 1.5°C during the three millennia since then. The Minoan Warm matched the Holocene peak, and the Roman Warm, Medieval Warm, and Modern Warm have produced successively lower peaks, judging by the Greenland ice core data: 4.7°C, 4.0°C, and 3.3°C, resp.
I don't understand your viscosity comment. The frequency doesn't have to be exactly eleven years to be seen. The sunspot cycle doesn't just effect the solar isolation but many other properties of the sun (magnetic field, solar wind etc). You have claimed that a variation of the sunspot cycle is seen where the cycle itself is not. How can this work? As to the correlation, could you give me the link to your second graph (the Danish data).
DeleteCertainly there must be reasons why the climate changes as you say on the order of hundreds of years. Many oceanographic cycles have been identified as you reference, that must be important and no doubt there are others yet to be discovered. All one big chaotic stew, no doubt. On longer scales there are the Milankovitch cycles which is a type of solar variation. However if you are going to invoke a sunspot cycle effect you must explain why it is not seen. I suspect it is lost in the noise and buried by other much stronger effects.
Is this it (Figure 6a)?
Deletehttp://www.dmi.dk/fileadmin/user_upload/Popart/solbetydningfravejret.pdf
Unfortunately I do not read Danish. In any case Figure 6b is not as encouraging.
Your lurking variable Z is something that effects sunspot period and terrestrial temperature but cannot itself be detected? Is this not special pleading?
No the original by Christensen and Lassen was back in 1991, long before the whole thing was subordinated to politics. The article you linked to was from 2012, and concluded something on the order of 0.4°C due to solar activity, with the relation being three years out of phase, due to various delays within the solar process.
DeleteViscosity in a system is the delay in system response following a change in the inputs. For example, when a change is made to a large glass furnace -- a different melt, change in gas, etc. -- it will be three days before it shows up in the properties of the glass. Every system with feedback will have some kind of viscosity in it. The ocean temperature stays warm for some time after sundown, for example. The earth will stay warm for some time after the heat is turned down. Etc. etc.
Who said Z cannot be detected? Here is a useful paper on "Lurking Variables"
http://www1.cmc.edu/pages/faculty/MONeill/Math152/Handouts/Joiner.pdf
So this is the report?
Deletehttp://www.friendsofscience.org/assets/documents/Solar%20Cycle%20-%20Friis-Chr_Lassen-.pdf
I don't understand why the cycle periods are smoothed. One is not supposed to smooth time series as it increases correlation.
I've never seen viscosity used this way. The term employed is usually inertia, sometimes thermal inertia.
Iran across the usage in an article about system modelling a number of decades ago.
Delete"The IPCC trends are based largely on the heavy red line, which hindsight is not showing to be the up-cycle from the bottom of the previous trough to the top of the current one (1970-2000)."
ReplyDeleteI think you meant to say "now" and not "not"?
Typo fixed. Thanks.
DeleteYou know what flips my balderdash alert system?
ReplyDeleteThe ~60-year Mauna Loa CO2-level rise is almost too linear.
I am always suspicious of such pretty "natural" linearity. Underneath, there **usually** abides bad assumptions or simplifications.
JJB